Ice Core Graph in Greenland
The ice core graph story is relevant to Adventist-Alumni because of its geochronological implications.
Graph Analysis
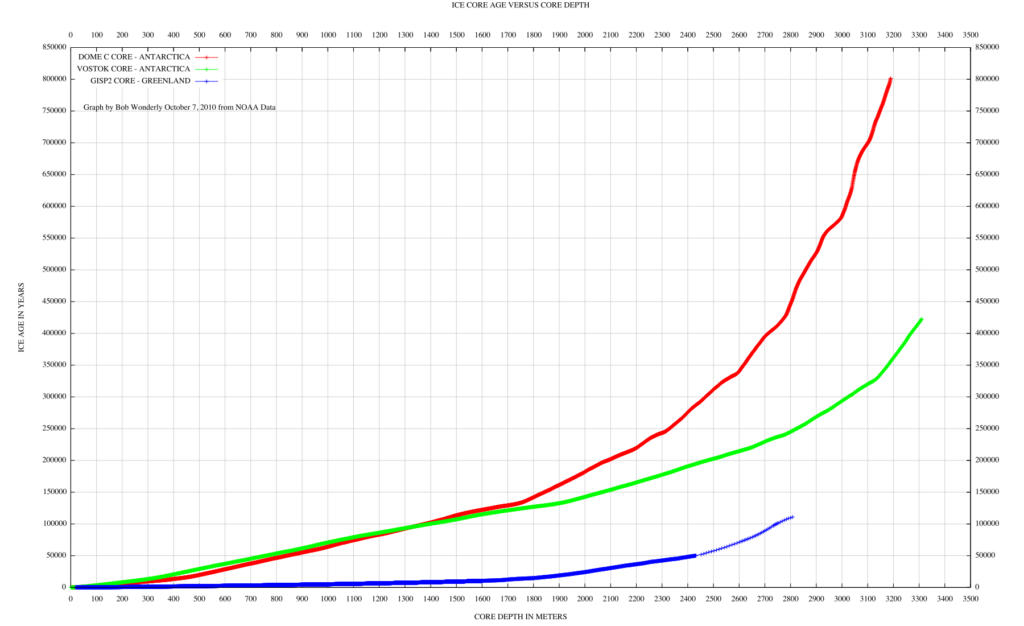
The three curves converge at the left because they all start “at the top” — which is taken to be where the top was in 1950. The horizontal axis is depth in meters, which of course, correlates in a non-linear fashion with the age of the ice which is the vertical axis.

- Blue curve — Greenland GISP2 — goes up (gets deeper) slowly compared to the red and green curves because Greenland receives much more snow each year than does Antarctica.
- Green curve — Vostok — is the deepest core but not the oldest.
- Red curve — Dome-C — is the oldest core. GISP2 covers one complete ice-age; Vostok four ice ages; and Dome-C eight complete ice-ages.
The ice ages can be clearly seen on temperature versus age/depth graphs which I do not yet have here.
About the Ice Core Graph Data
I must stop this otherwise I will be writing the promised expanded paper which I can’t do right now.
The data used in the plots is in the public domain and it is the purpose of this page to acknowledge and provide the web sites from which the data was obtained. I do not claim copyright on the graph itself. Permission is hereby granted for it to be used as is without changing it.
This graph was constructed by Bob Wonderly using gnu plot running on Mac OS-X. The data comes from official NOAA and related web sites. It is the point of this document to give the web locations for the data used.

Bob Wonderly
Founder of adventistalumni.com, is a retired mathematician, computer scientist, and former faculty of Andrews University.

