Faith On Ice: Great Ice Fields of Greenland
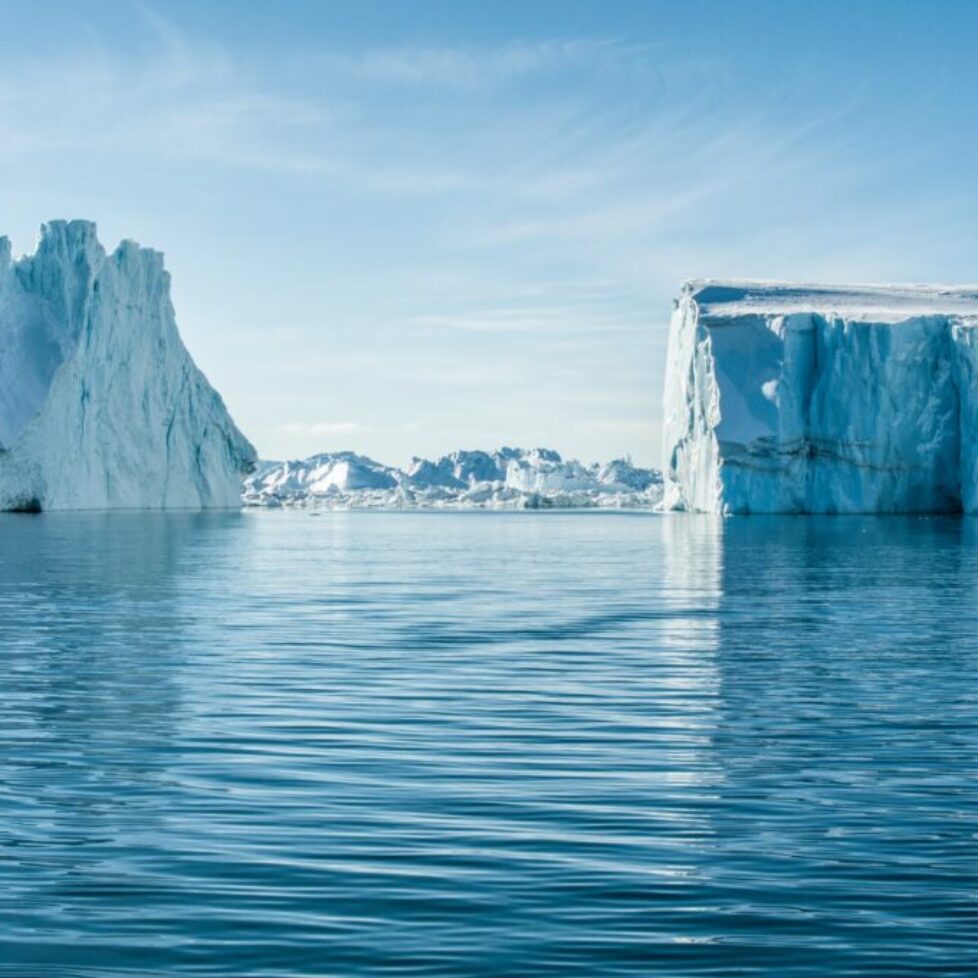
Ice core research steps back in time and makes guesses at the future. Using ice penetrating radar and satellite mapping technology, oceanographers and other earth scientists have determined that the great ice fields of Greenland and Antarctica currently contain enough ice to raise sea level approximately 200 feet above where it is today, if all that ice were to melt.
Understanding Past Environmental Conditions
Roughly 80% of the world’s ice is in Antarctica and almost all of the remainder is in Greenland. The other ice fields and glaciers around the world contain less than 1.0% of the earth’s current total ice mass. From extensive study of sea floor sediment cores and coral cores, it has been determined that at several times during geological time, the sea level was as much as 400 feet lower than it is today. Where did all of that water in the oceans go? During significant periods of time, referred to as ice ages, this water was locked up in large continental glaciers containing approximately three times the mass of the current Greenland and Antarctic ice fields combined.
The most important part of this discovery was that contained in the ice of Greenland and Antarctica are physical records–sometimes called proxy records–of past environmental conditions on earth. We use proxies all the time. For example, before mercury was banned, the expansion of mercury in a thermometer was used as a proxy for the concept of temperature.
Many types of events occurring over geologically recent times are recorded in the ice. From the oxygen isotope ratios in the water of the ice, scientists can deduce a history of temperature changes. From air bubbles trapped in the ice, which contain samples of oxygen, nitrogen, carbon dioxide, and methane, it is possible to infer ocean chemistry and earth biomass history, and, of course, air quality history.
Examining the Ice Fields
After preliminary studies, scientists picked two locations 18 miles apart in the center of Greenland where they would core into the ice to bedrock. The idea was to drill where the movement of the ice over time would be minimized and to have two parallel cores for a double check that the correct story was being deduced from the ice. Taken as a whole, the data from the two cores is very similar. Because of this, the discussion here will focus primarily on the core designated GISP2 (Greenland Ice Sheet Project II), drilled by a team of Americans.
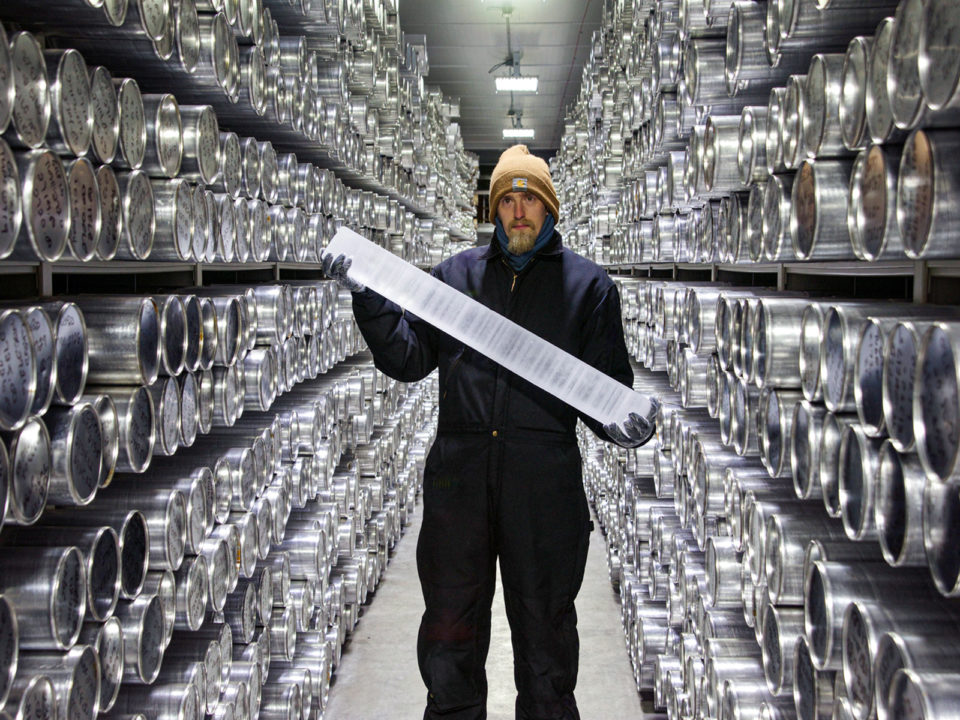
The core is basically 5 inches in diameter, coming out in sections several feet long. The sections are carefully logged, weighed and measured then sawn in two lengthwise for further analysis. It is important to understand that separate annual layers can be detected by the naked eye for most of the distance down the GISP2 core. The summer and winter ice look different so the layers can be resolved sub-annually. The summer sun and winter darkness generate atmospheric reactions, the differing signatures of which get trapped in the ice. The spray that blows up onto the
ice from the shore, in spring storms after the ice pack has broken up, has a stronger salt signature than in winter when the sea is frozen over for a long distance out from land. The ice layers also have a significant signature of dust that blows in from the deserts of Asia, carried high aloft around the world by the wind. The dust layer signature is strongest in the winter ice.
An acquaintance who has seen a section of the GISP2 core (which is stored near Denver, Colorado) from about 20,000 years ago reported that he could clearly distinguish the annual layers and resolve the summer/winter ice difference.
Matching History to Facts
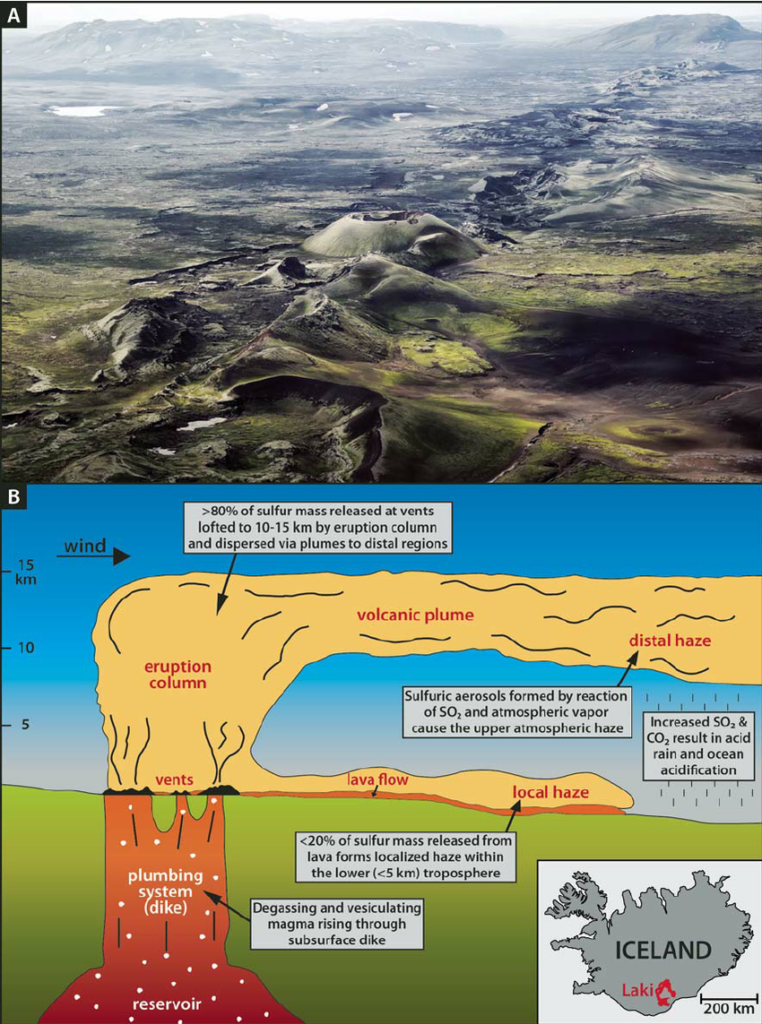
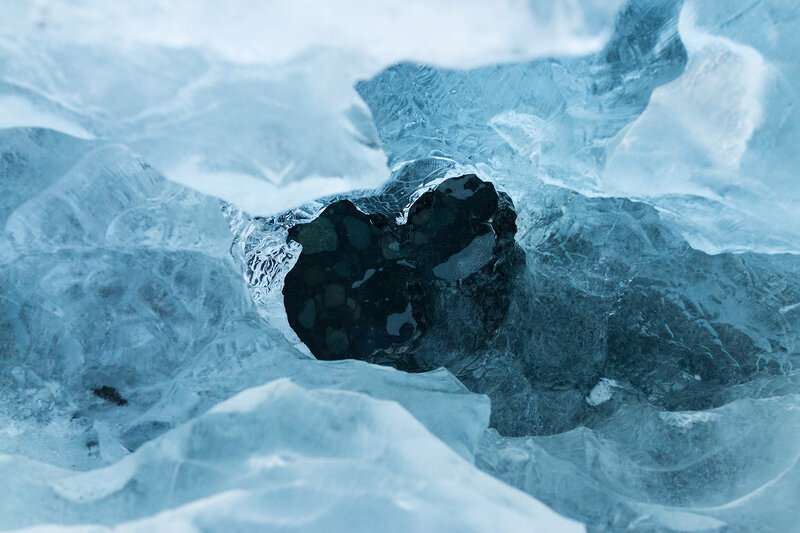
Examples of ancient and modern records of materials and events recorded in Greenland ice cores include pollen, micro-meteorites, lead, copper smelting dust, freon, chemicals from the trees that make the bluish haze over the forests in the Appalachian Mountains, along with acid rain and acid snow–with summer and winter levels being different. Volcanoes make a strong sulfuric acid signature, easily detected by instrumentation.
The story that the ice cores tell may be of interest to Seventh-day Adventists because of what it says about geochronology. One reason scientists sought data from the ice is because of the long-term climate information it carries. To maximize the information that can be recovered from the ice record, it was important to determine as accurately as possible the chronology of the ice layers.
This included carefully synchronizing the dating of the layers with events that could be well-dated from known history. For example, in the early years of working on the ice studies, scientists knew they were on the right track when their layer counting was synchronized to the exact year of an accurately dated volcanic eruption that occurred in Iceland in 1783.
The sulfuric acid level shot way up in the corresponding layer. They also found ash shards there that chemically matched with ash known to be from the volcano in Iceland. All the other well dated volcanoes synchronized with their layer chronology, including Vesuvius in 79 AD. The lead signature (measured in an earlier core) showed up when the ancient Romans started using lead in their plumbing technology; it started climbing during the industrial revolution; shot up during the use of leaded gasoline and dropped steeply down when leaded gasoline was phased out.
The freon signature matches the known history of its use. The copper smelting dust signature jumped significantly in synchronization with what archaeologists know about the time that humans have been smelting copper. The sulfuric acid and ash shard signature of the volcano (Mount Mazama) which made Crater Lake in Oregon shows up in the ice core at level 7,676. Multiple radiocarbon dates had previously dated one major eruption of this volcano at 7,680±10 years ago.
Counting the Years
At 10,016 feet the drillers hit bedrock. By this time, the scientific teams working on the core had counted 120,000 annual layers. The layers can be counted by eye for 50,000 years then, as expected, it becomes easier to resolve them with instruments. Even so, the bottom most layers, rather than being paper thin, average a few millimeters thick. Using laser technology and sensitive instruments, the atmospheric dust level was recorded for the entire 120,000 years. This data is resolved sub-annually, a ziz-zag line cycling up and down each year. More importantly, when a four-year running average smoothing protocol is applied to the data, the dust shows a periodic significantly strong intensity, with a period that synchronizes with the 11-year sun spot cycle. This is a very strong argument that refutes claims that the layers below where consequences of historical events can be detected are not annual, orbital, layers, but correspond to cyclic storm activity. (See the Data Graph)
The GISP2 core from Greenland is a kind of “gold standard” for ice core dating. When the temperature data based upon the oxygen isotope proxy is plotted it clearly shows one ice age cycle which consists of about ninety thousand years of cold followed by about ten thousand years of warm. Here the difference between cold and warm is but a few degrees centigrade. We are now a dozen or so thousand years into the warm cycle.
The Dome-C ice Field in Antarctica
As of 2007, scientists working with data from the Dome-C core in Antarctica had an ice chronology going back 801,000 years (eight complete ice-age cycles). Before Dome-C there was Vostok. The four kilometer ice core brought up there had four complete ice age cycles. I have a personal friend who has been on the ice in Antarctica at Vostok. Upon his request he was shown the section of core in which the dust from Mount Mazama (Crater Lake in Oregon) appears. He could see the dust layer with his unaided eye. That layer appears only about one fourth of a kilometer down the core. It is important that I point out that dating the cores from Antarctica is, because of its much lower rate of precipitation than in Greenland, more complex than unaided-eye annual layer counting.
A natural question that arises is whether or not there is any perturbation detectable in the ice consistent with a recent global flood. The answer is no, none at all. However knowing that sea level at the height of the most recent cold period was 400 feet lower than today tells us why so many ancient cultures had flood stories integrated in with their world views. Save for Greenland and Antarctica, the great continental ice sheets are gone. Nevertheless geologists find not only their footprints but can identify approximately when and where their major collapses took place, collapses that raised the level of the sea significantly in a very short time frame. Four obvious escape routes for the water from major collapses in North America are the Columbia River (west to the Pacific), the Mackenzie River (north to the Arctic), the Saint Lawrence River and the Hudson Bay (both dumping into the Atlantic).
Signs of Life?
When sea level rose sufficiently the ancient land bridge at the Bosporus Strait collapsed. Enough salt water from the Mediterranean Sea poured in on top of the once freshwater lake now called the Black Sea to raise its level four hundred feet. Robert Ballard has found human artifacts along what was the shoreline of this lake before it was inundated at about the same time that Mount Mazama blew its top.
What about life? Any signs of life deep within these cores? As a matter of fact, there is. Near the top of the third ice age down in the Vostok core the scientists found microscopic life. And I already mentioned pollen in the GISP2 core.
My thanks to Bonnie Dwyer (circa 2002) for the title.

Bob Wonderly
Founder of adventistalumni.com, is a retired mathematician, computer scientist, and former faculty of Andrews University.


